Twelve Months, Three Platforms, One Nervous Breakdown: What Posting Art Online Actually Earns You
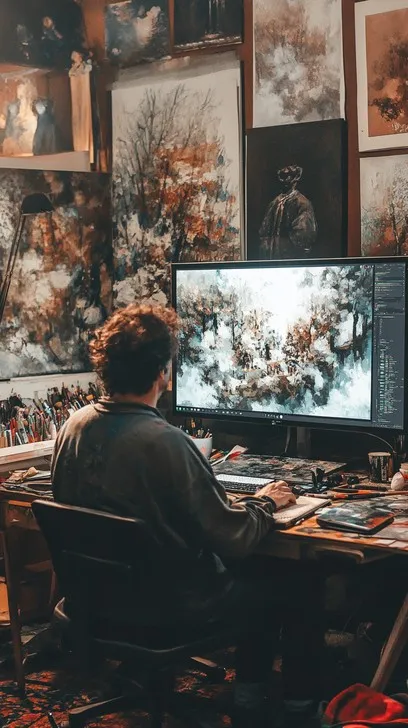
Photo: artist checking analytics on laptop in studio surrounded by paintings, via images.stockcake.com
In January, an artist we'll call R. — a mid-career painter who asked to keep the focus on the data rather than the name — opened a spreadsheet and made a deal with herself: twelve months, three platforms, everything tracked. Every post. Every like. Every sale. Every hour spent making content instead of making work.
What follows is her year, with her numbers and her permission. If you've ever been told to 'just be consistent on social,' read this before you believe it.
The Setup
R. started with roughly 4,200 Instagram followers accumulated over eight years of casual posting, zero TikTok presence, and a Pinterest account she describes as 'abandoned since 2019.' Her baseline income from art was modest but real: around $700 a month in average sales through her website and word of mouth.
The plan was simple. Post to Instagram four times a week. Post to TikTok three times a week. Pin to Pinterest daily. Track everything: time spent, reach, engagement, site traffic, and — the column that would turn out to matter most — actual dollars.
Quarter One: The Honeymoon
TikTok did what TikTok does. One process video — forty seconds of her underpainting set to a trending audio — hit 380,000 views in March. Her follower count there leapt from 0 to 11,000 in six weeks. Friends sent congratulations. A small art newsletter mentioned her.
Sales attributable to that video: zero.
Not 'few.' Zero. Her site traffic doubled, and the conversion rate on that traffic was functionally nil. Virality, it turns out, is an audience of strangers who enjoyed eight seconds of your life and owe you nothing.
Instagram, meanwhile, was slower and stranger. Her reach had declined roughly 60% from her 2019 baseline — a story every artist on the platform will recognize — but her existing followers still bought. A single carousel of finished paintings in February drove $540 in sales. Total time invested: about twenty minutes.
Quarter Two: The Grind and the First Real Signal
By May, the schedule was eating roughly twelve hours a week — time pulled directly from the studio. Her production of new work dropped by a third. She describes the period bluntly: 'I was a content creator with a painting habit.'
But the spreadsheet surfaced something the hype never mentions. Pinterest — the platform everyone ignores — was quietly becoming her best referral source. Not for reach; her pins averaged a few hundred saves each. For intent. People arriving from Pinterest spent an average of four minutes on her site and bought at a rate roughly nine times higher than TikTok traffic. Pinterest users arrived looking for something to acquire. TikTok users arrived looking for something to watch.
Her first Pinterest-attributed sale came in June: a $850 original. Total content effort for the month across all platforms: sixty-plus hours. Total sales: $1,240.
Quarter Three: The Emotional Invoice
The numbers through summer were steady but unspectacular. Instagram grew from 4,200 to 5,900 followers. TikTok stalled at 14,000 after the algorithm stopped favoring her content — an entirely external event that she had zero control over and which cut her average views by 80% in a single week.
This is the part of the story that rarely gets documented: the whiplash. One week her work reached 300,000 people; the next, 3,000, with no change in quality, effort, or output. 'I started making work for the version of the algorithm that existed last month,' she wrote in her July notes. 'Which means I was always making it for the past.'
The emotional cost, documented in her own log: two months of making TikTok-first content — faster, louder, more process-forward — that she admits was worse work. She sold nothing from it that she was proud of.
Quarter Four: The Reckoning
In October, R. cut the schedule in half. TikTok went to one post a week, recycled from studio footage she was shooting anyway. Instagram stayed at three. Pinterest stayed daily but automated — pins scheduled in one monthly batch.
Revenue went up.
Not dramatically. But November and December combined out-earned the previous six months, driven almost entirely by email — a list of 1,100 people she'd been neglecting — and by Pinterest, which by year's end accounted for 40% of her site traffic and, by her tracking, the majority of her original sales.
The Year in Numbers
- Hours spent on content: ~480
- Follower growth: Instagram +1,700, TikTok +14,000, Pinterest +2,300
- Sales attributed to TikTok: $0
- Sales attributed to Instagram: ~$2,900
- Sales attributed to Pinterest and email: ~$6,400
- New work produced: down roughly 25% from the previous year
What the Data Actually Says
Three conclusions, none of which will go viral:
Engagement is not demand. The platform that made her famous paid her nothing. The platform that made her boring paid her rent. Reach measures attention; conversion measures intent, and they live in different places.
Owned audiences beat rented ones. Every dollar that came through email or her own site arrived without an algorithm's permission. Everything else was weather.
The feed is a cost center. It has value — discovery, community, the occasional collector finding you — but it should be treated like an expense to be minimized, not a job to be maximized.
R.'s year ends with a decision she says she should have made in month one: the studio gets the best hours of the day, the spreadsheet gets fifteen minutes a week, and the algorithm gets whatever's left. The art, she notes, got better the moment she stopped asking it to perform.
The algorithm giveth. The algorithm taketh. The spreadsheet, at least, tells the truth.